Random Event Generator Study
Data were recorded from two random event generator systems in Amsterdam, one in
Utrecht, two in Freiburg, two in Durham, one in Giessen, one in Edinburgh and
five systems in Princeton. The available data are thus from 14 independent REG
systems in seven different locations, all in the US or Europe.
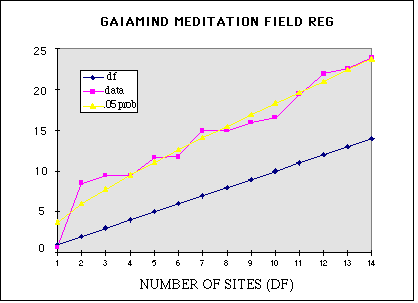
The data can be displayed graphically, as a cumulative Chisquare over the 14 independent
recordings, which allows the relative sizes of the separate contributions to be
visualized. Since the data were taken concurrently, the order in which they are
displayed is arbitrary; of course, the final value of the accumulated deviation
is not affected by the order. The figure also includes the expectation (df), which
in this case is also the number of segments, and an envelope showing the locus
of the 5% probability for so large a Chisquare as the number of samples increases.
The last line in the table, and the last point on the graph both show the result
when the data are concatenated across the 14 different devices. This overall accumulation
represents a result that falls in the range considered significant by most scientists.
It would occur by chance less than 5 times in 100 repetitions of the full experiment,
and it supports the pre-stated hypothesis that the output of the various random
event generators would deviate from expectation during the time of the global
meditation.

